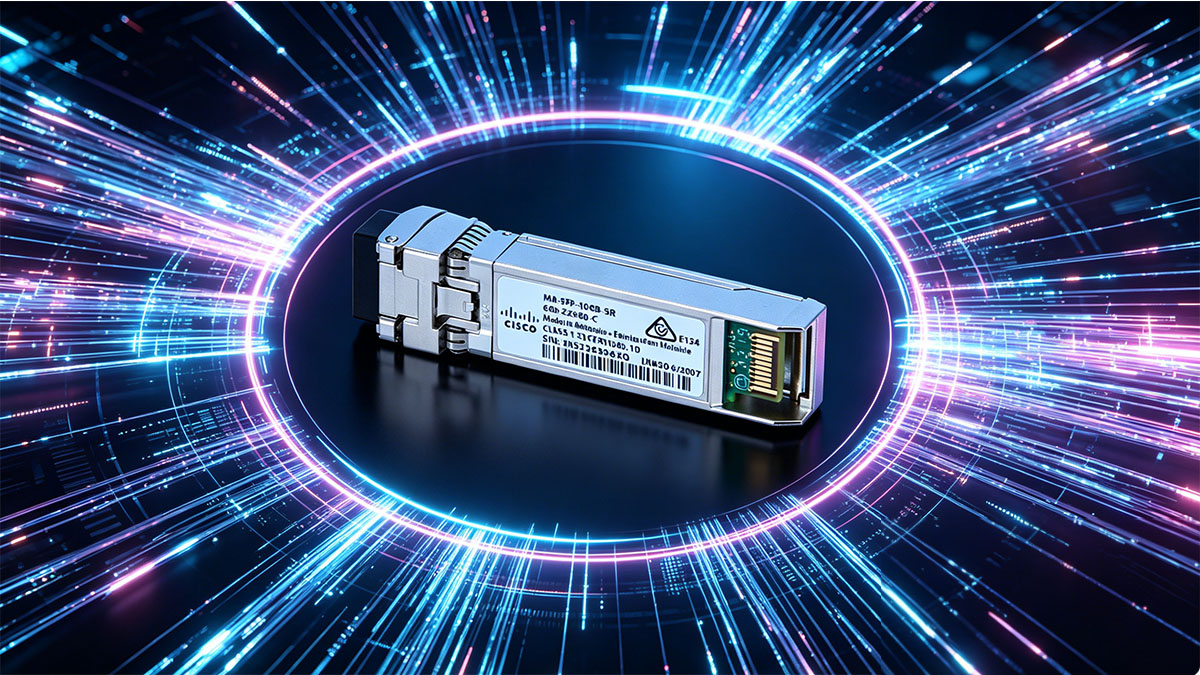
The deployment of high-speed data center and enterprise campus networks increasingly relies on 10Gb Ethernet optical solutions such as the Meraki 10G-Base-SR Multi Mode module. As network traffic continues to grow driven by cloud computing, virtualization, and high-bandwidth applications, ensuring stable short-range optical connectivity has become a critical design requirement rather than an optional optimization.
At the core of any reliable optical link is the concept of link budget, which defines whether a fiber connection can maintain sufficient signal strength from transmitter to receiver over a given distance. For Meraki 10G-Base-SR Multi Mode environments, link budget analysis is especially important because short-range multimode systems operate within tight optical power margins where even small losses can impact stability.
Understanding how link budget works in 10G-SR deployments helps network engineers avoid common issues such as signal degradation, intermittent link failures, and performance bottlenecks. It also provides a structured way to evaluate fiber types, connector quality, and installation practices before deployment.
This article explains the technical foundation of Meraki 10G-Base-SR Multi Mode optics, breaks down how link budget is calculated and applied, and highlights practical factors that influence real-world optical performance.
🔔 Understanding Meraki 10G-Base-SR Multi Mode Optics
Meraki 10G-Base-SR Multi Mode optics are designed to deliver reliable 10Gbps short-range connectivity within data center racks, campus aggregation layers, and high-density enterprise switching environments. In practical terms, this optical module is optimized for scenarios where high bandwidth is required over relatively short distances using multimode fiber infrastructure.
Before analyzing link budget behavior in detail, it is essential to understand what defines 10G-Base-SR technology, how Meraki implementations align with this standard, and where these optics are typically deployed in real networks.
What is 10G-Base-SR Multi Mode?
The 10G-Base-SR standard refers to a short-range 10 Gigabit Ethernet optical transmission technology operating over multimode fiber. It uses an 850nm wavelength, which is optimized for Vertical-Cavity Surface-Emitting Laser (VCSEL) technology, making it suitable for cost-efficient short-distance optical transmission.
In practical deployment, 10G-Base-SR is widely used because it balances performance and infrastructure simplicity. It does not require single-mode fiber, which reduces overall cabling cost and complexity in structured cabling environments.
A simplified comparison of typical operating characteristics helps clarify its positioning:
| Parameter |
Typical Value |
Practical Impact |
| Wavelength |
850nm |
Optimized for multimode fiber transmission |
| Fiber Type |
OM3 / OM4 |
Determines achievable distance |
| Max Distance |
Up to 300–400m |
Suitable for intra-building links |
| Data Rate |
10Gbps |
Supports high-bandwidth applications |
This combination of parameters makes 10G-Base-SR one of the most commonly deployed short-range optical standards in modern enterprise networks.
Key Features of Meraki 10G-Base-SR Modules
Meraki 10G-Base-SR modules are designed to integrate seamlessly into Meraki switching ecosystems while maintaining compatibility with industry-standard multimode fiber infrastructure. Their design focuses on operational simplicity and stable performance under typical enterprise conditions.
From a functional perspective, these modules are characterized by several core features:
- Support for hot-swappable installation, enabling minimal service disruption during upgrades or replacements
- Optimized power efficiency to reduce thermal load in high-density switch environments
- Standardized form factor compatibility with SFP+ ports across Meraki switch platforms
- Consistent optical performance aligned with IEEE 10GBASE-SR specifications
These characteristics ensure that Meraki deployments maintain predictable behavior across distributed network environments, which is essential when evaluating link budget stability across multiple links.
Beyond hardware design, consistency in optical output and receiver sensitivity also plays a critical role in ensuring that link budget calculations remain valid under real-world conditions.
Common Deployment Scenarios
Meraki 10G-Base-SR Multi Mode optics are typically deployed in environments where high-speed connectivity is required over short distances, and where fiber infrastructure is already standardized on multimode cabling.
Common real-world use cases include:
- Data center top-of-rack (ToR) to aggregation switch connections
- High-density server interconnects within the same rack row
- Enterprise campus backbone links between wiring closets
- Storage network extensions requiring low-latency 10Gbps throughput
In these scenarios, the emphasis is not on long-distance transmission but on maximizing throughput efficiency while maintaining predictable optical performance. This is exactly where link budget analysis becomes critical, as even minor variations in fiber quality or connector loss can determine whether a link operates within safe optical margins.
As network architectures continue to evolve toward higher density and faster speeds, understanding where and how Meraki 10G-Base-SR modules are deployed provides the foundation for accurate link budget evaluation in subsequent design stages.
🔔 What is Link Budget in Optical Communication?
In optical communication systems such as those using Meraki 10G-Base-SR Multi Mode modules, link budget represents the total allowable optical loss that a fiber link can tolerate while still maintaining reliable signal transmission. In simple terms, it answers a critical question: whether the transmitted light signal will still be strong enough when it reaches the receiver after traveling through fiber, connectors, and other passive components.
Understanding link budget is essential because optical signals naturally weaken as they travel. If total losses exceed the system's allowable margin, the connection may experience instability, errors, or complete failure. For 10G-SR multimode systems, where power margins are relatively tight, accurate link budget planning is especially important.
Definition and Core Concept
Link budget is defined as the difference between the optical power output of the transmitter and the minimum optical power required by the receiver to correctly interpret the signal.
This relationship can be summarized using the fundamental principle:
Link Budget = P_tx - P_rx
Where:
- P_tx represents transmitter output power
- P_rx represents receiver sensitivity (minimum required input power)
In real-world optical networks, this budget must be greater than the total accumulated losses in the link, including fiber attenuation, connector insertion loss, and splice loss.
A practical breakdown of link budget components is shown below:
| Component |
Description |
Typical Impact |
| Transmitter Power |
Optical output from SFP/SFP+ module |
Determines signal launch strength |
| Receiver Sensitivity |
Minimum required signal level |
Defines detection threshold |
| System Losses |
Fiber + connectors + splices |
Reduces usable signal power |
This structure helps engineers evaluate whether a given optical link design is physically viable before deployment.
After establishing this balance, engineers can determine whether additional amplification, shorter cable runs, or higher-quality components are required.
Why Link Budget Matters
Link budget is not just a theoretical concept—it directly determines the stability and reliability of optical networks. In Meraki 10G-Base-SR Multi Mode deployments, even small miscalculations can lead to performance degradation due to the limited optical margin of short-range multimode systems.
From a practical engineering perspective, link budget is important for several reasons:
- It ensures that optical signals remain above the receiver sensitivity threshold under all conditions
- It helps prevent intermittent link failures caused by marginal power levels
- It provides a baseline for validating fiber infrastructure design before installation
- It enables predictable scaling when adding new links or extending network topology
When properly calculated, link budget acts as a safety boundary that protects the network from environmental variations such as temperature fluctuations, connector aging, and minor installation imperfections.
In modern enterprise environments where uptime is critical, link budget analysis is often integrated into standard network design validation procedures.
Key Components of Link Budget
A complete understanding of link budget requires breaking it down into its core physical components. These elements define how much optical power is available and how much is lost across the transmission path.
The main components include:
- Transmitter output power (measured in dBm)
- Receiver sensitivity threshold (measured in dBm)
- Total optical loss (measured in dB), including fiber attenuation and hardware losses
Each of these elements contributes to the overall feasibility of a fiber link. A simplified view of their interaction is shown below:
| Parameter |
Unit |
Function |
| Transmitter Power |
dBm |
Launch optical signal strength |
| Receiver Sensitivity |
dBm |
Minimum detectable signal level |
| Link Loss |
dB |
Total attenuation across fiber path |
Once these values are known, engineers can determine whether a link operates within safe margins or requires redesign.
In practice, maintaining sufficient link budget headroom is just as important as meeting the minimum requirement, since real-world conditions often introduce additional unexpected losses over time.
🔔 Link Budget Specifications for Meraki 10G-Base-SR Multi Mode
For Meraki 10G-Base-SR Multi Mode optical modules, link budget specifications define the practical operating window in which the optical signal can reliably travel across multimode fiber links. These specifications are essential because they determine the maximum allowable loss between transmitter and receiver while still maintaining stable 10Gbps communication.
In real-world deployments, understanding these values helps engineers validate whether a given fiber infrastructure (OM3 or OM4) can support the intended distance and connectivity design without exceeding optical limits.
Typical Optical Parameters
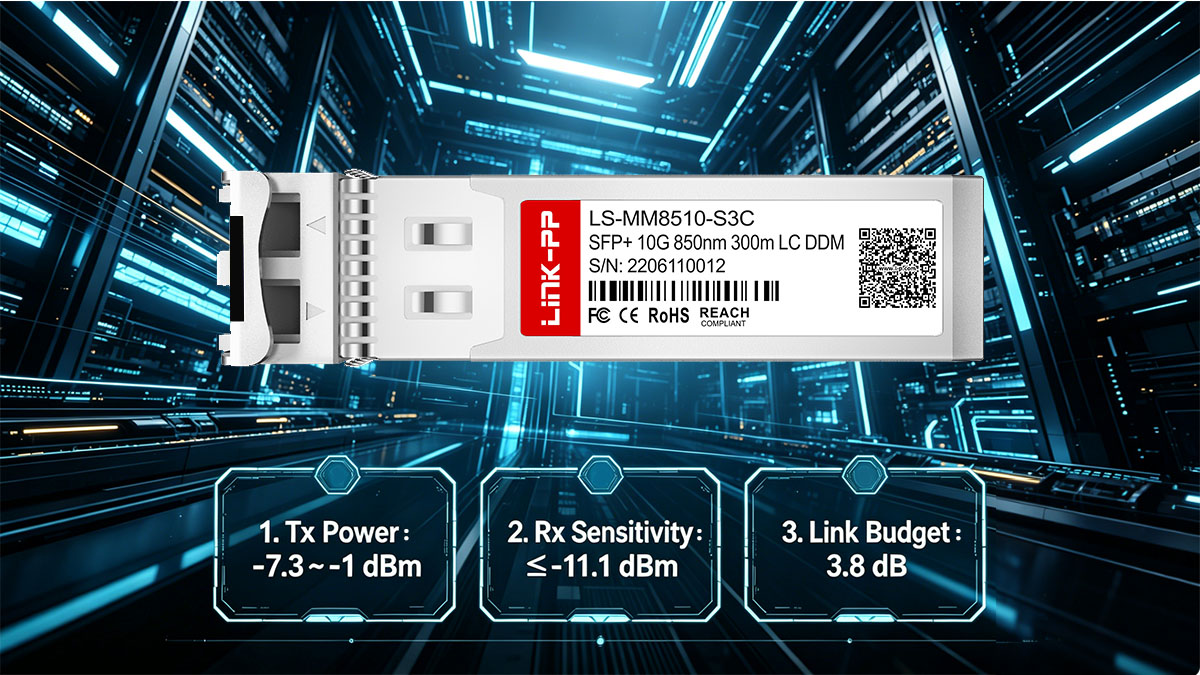
The performance of Meraki 10G-Base-SR modules is defined by a set of standard optical parameters, including transmit power, receiver sensitivity, and resulting link budget. These values form the foundation for any link design decision.
A typical specification overview is shown below:
| Parameter |
Typical Range |
Engineering Role |
| Transmit Power |
-7.3 to -1.0 dBm |
Defines launched optical signal strength |
| Receiver Sensitivity |
≤ -9.9 dBm |
Minimum detectable optical input |
| Link Budget |
~2.6 to 3.0 dB |
Maximum allowable loss margin |
| Wavelength |
850nm |
Optimized for multimode transmission |
These values illustrate that 10G-Base-SR operates within a relatively narrow power window. As a result, even small losses from connectors or poor fiber quality can significantly impact link stability.
To ensure reliable performance, designers must ensure that total system loss remains below the available link budget, with additional safety margin included.
Fiber Type and Distance Impact
The achievable distance of Meraki 10G-Base-SR Multi Mode links is highly dependent on the type of multimode fiber used. OM3 and OM4 fibers differ primarily in bandwidth-distance characteristics, which directly affect how far a 10Gbps signal can travel while staying within the link budget.
A comparison of typical fiber performance is shown below:
| Fiber Type |
Effective Modal Bandwidth |
Max Distance (10GBASE-SR) |
Practical Use Case |
| OM3 |
2000 MHz·km |
Up to 300m |
Standard enterprise cabling |
| OM4 |
4700 MHz·km |
Up to 400m |
High-density data center links |
| OM2 |
500 MHz·km |
~82m (limited use) |
Legacy environments |
From a link budget perspective, OM4 fiber provides greater tolerance for loss accumulation over distance, making it more suitable for modern high-density deployments where cable paths may be longer or more complex.
However, it is important to note that distance is not the only limiting factor—connector losses and patch panel design can reduce the effective usable budget significantly before fiber attenuation becomes the dominant factor.
Environmental and Hardware Influences
While theoretical link budget calculations assume ideal conditions, real-world performance is affected by environmental and hardware-related factors that introduce additional losses into the system.
These influencing factors include:
- Temperature variations affecting optical transmitter output stability
- Connector quality and polishing precision influencing insertion loss
- Dust, contamination, or oxidation on fiber end faces
- Aging of transceiver laser components over time
Each of these factors can reduce the effective link margin even if the initial design meets specification requirements. In particular, connector cleanliness is one of the most common causes of unexpected link budget degradation in field deployments.
To better illustrate their relative impact, consider the following simplified breakdown:
| Factor |
Type of Loss |
Typical Impact Range |
| Fiber attenuation |
Distance-based |
~3.0 dB/km (OM3/OM4 typical) |
| Connector loss |
Point loss |
0.2–0.5 dB per connector |
| Splice loss |
Fixed loss |
~0.1–0.3 dB per splice |
When combined, these losses can quickly consume a significant portion of the available link budget, especially in densely patched environments such as data centers.
Therefore, maintaining strict control over physical installation quality is just as important as selecting the correct fiber type when designing Meraki 10G-Base-SR links.
🔔 How to Calculate Link Budget for 10G-Base-SR
Calculating the link budget for a 10G-Base-SR multimode optical link is a fundamental step in ensuring that the Meraki 10G-Base-SR Multi Mode deployment will operate reliably under real-world conditions. The goal is to confirm that the total optical losses across the entire link do not exceed the available power margin provided by the transceiver.
In practice, this calculation is not just a theoretical exercise—it directly determines whether a planned fiber link will function correctly once installed, or whether adjustments in fiber type, distance, or connector layout are required.
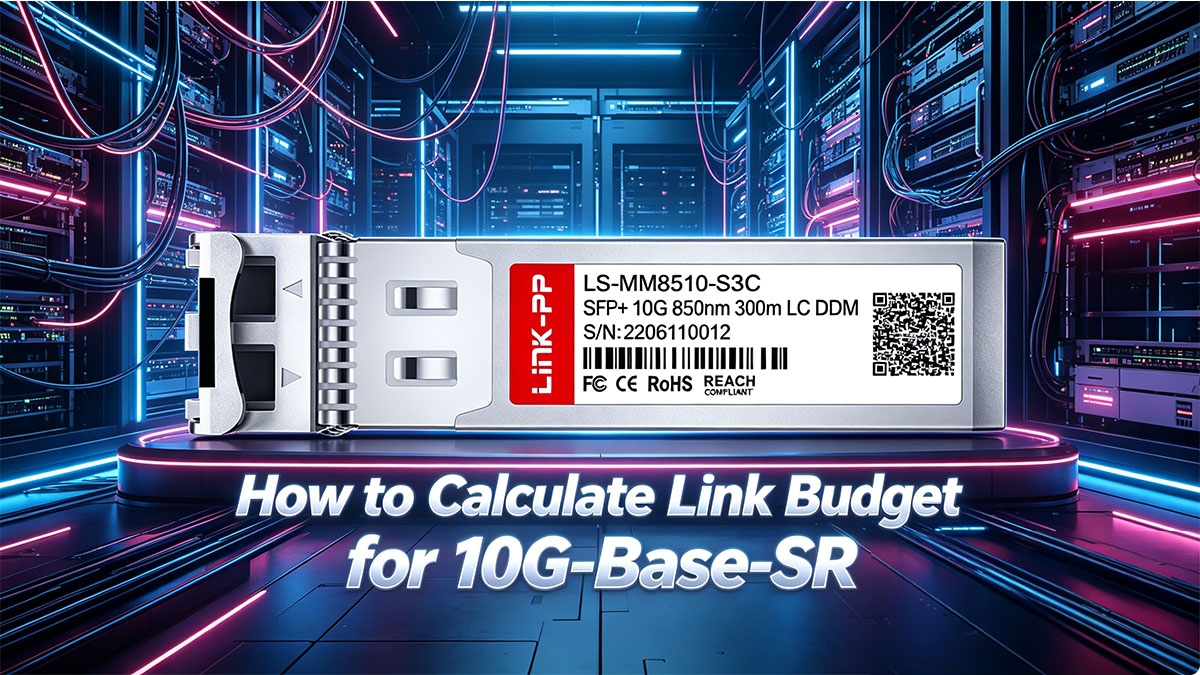
Basic Link Budget Formula
At its core, link budget calculation is based on the difference between transmitter output power and receiver sensitivity. This defines the maximum allowable loss that the system can tolerate.
The fundamental relationship is expressed as:
Link Budget = -5 - (-9.9) = 4.9 dBm
This represents a simplified example using typical values where:
- Transmitter power is assumed around -5 dBm (example reference value)
- Receiver sensitivity is approximately -9.9 dBm
In real engineering terms, the formula is:
Link Budget = Transmit Power (dBm) − Receiver Sensitivity (dBm)
However, this theoretical budget must always be compared against real system losses to determine feasibility.
After establishing this basic threshold, engineers then evaluate whether the physical fiber link remains within acceptable limits once all loss factors are included.
Step-by-Step Calculation Example
To understand how link budget works in a real Meraki 10G-Base-SR Multi Mode scenario, consider a typical short-range fiber connection inside a data center.
Before applying numbers, it is important to recognize all contributors to optical loss. These include fiber attenuation, connector loss, and any patch panel or splice points.
A typical calculation process includes the following steps:
- Determine transmitter and receiver specifications
- Estimate fiber attenuation based on distance
- Add connector and patch panel losses
- Compare total loss against available link budget
For example, assume:
- Transmitter power: -3 dBm
- Receiver sensitivity: -10 dBm
- Fiber length: 100 meters OM3
- Fiber attenuation: ~3 dB/km
- Connector loss: 2 connectors at 0.3 dB each
The loss estimation can be summarized as:
| Component |
Value |
Total Loss Contribution |
| Fiber (100m OM3) |
0.3 dB/km × 0.1 km |
0.03 dB |
| Connectors |
2 × 0.3 dB |
0.6 dB |
| Patch panels |
1 × 0.2 dB |
0.2 dB |
| Total Loss |
— |
0.83 dB |
After calculating total loss, it is compared against the available link budget:
- Available budget: (-3) − (-10) = 7 dB
- Actual system loss: 0.83 dB
Since the system loss is significantly lower than the available budget, the link is considered stable with sufficient margin.
This margin is important because it absorbs unexpected real-world variations such as aging, dust contamination, or minor installation inconsistencies.
Accounting for Safety Margins
In practical network design, it is not sufficient to simply meet the minimum link budget requirement. Engineers must also include a safety margin to ensure long-term stability under non-ideal conditions.
A commonly recommended approach is to reserve 1–2 dB of additional margin.
This means that even if a link appears valid in theoretical calculations, it should still be evaluated with headroom for real-world degradation factors such as:
- Connector wear over time
- Temperature-induced optical fluctuations
- Slight misalignment in patch connections
- Future network reconfiguration or expansion
A simplified interpretation of margin planning is shown below:
| Category |
Value Range |
Design Implication |
| Theoretical budget |
3–7 dB typical |
Based on device specs |
| System losses |
0.5–2 dB typical |
Installation dependent |
| Safety margin |
1–2 dB recommended |
Ensures long-term reliability |
After incorporating these factors, engineers can confidently determine whether a Meraki 10G-Base-SR link will remain stable not only at installation time but throughout its operational lifecycle.
🔔 Factors Affecting Link Budget Performance
In Meraki 10G-Base-SR Multi Mode optical deployments, link budget performance is not determined solely by theoretical calculations. In real-world environments, multiple physical and operational factors continuously influence how much optical power is actually preserved across the link. Even when initial calculations appear valid, these factors can gradually reduce available margin and impact long-term stability.
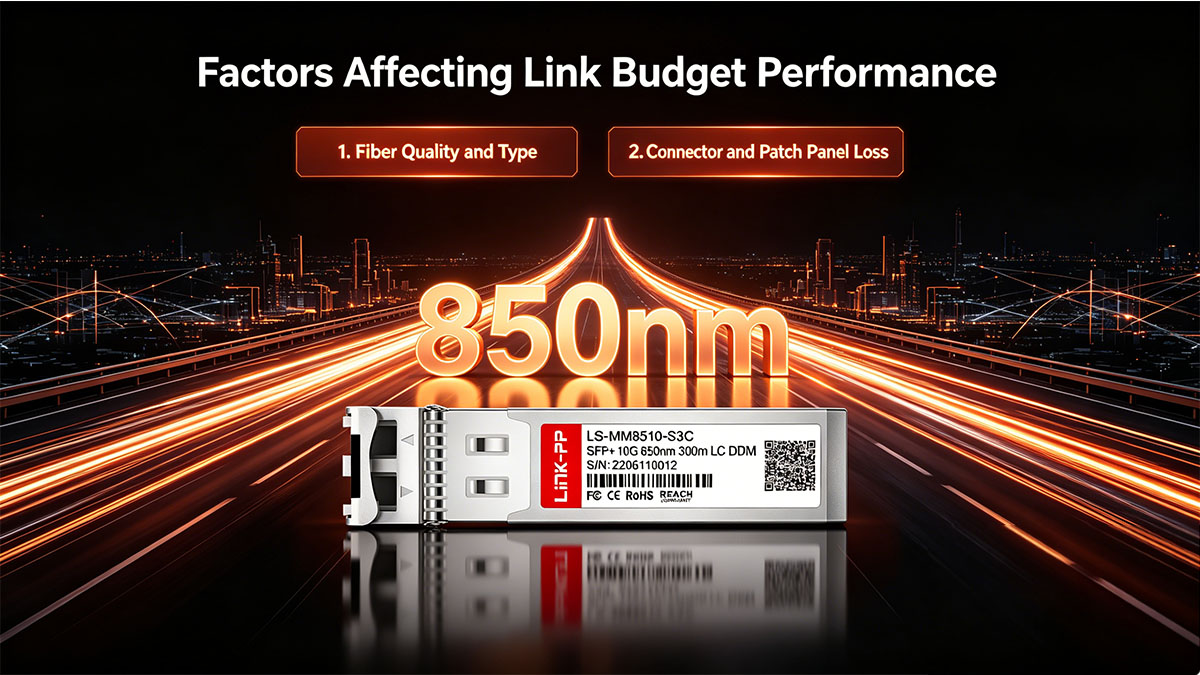
Understanding these influences is essential for designing reliable 10GbE short-range fiber links, especially in data center and enterprise campus networks where link density is high and physical cabling conditions vary.
Fiber Quality and Type
The type and quality of multimode fiber used in a 10G-Base-SR link directly affect signal attenuation and modal dispersion, both of which contribute to link budget consumption. While OM3 and OM4 fibers are both compatible with 10GBASE-SR, their performance characteristics differ significantly.
In practical terms, higher-grade fiber reduces loss accumulation over distance and provides better tolerance for complex routing paths.
| Fiber Type |
Bandwidth-Distance Capability |
Loss Behavior |
Typical Usage |
| OM3 |
Moderate |
Higher attenuation over distance |
Standard enterprise links |
| OM4 |
Higher |
Lower effective loss impact |
Data center backbone links |
| OM2 |
Limited |
Higher dispersion and loss |
Legacy environments |
From a link budget perspective, OM4 fiber offers more flexibility by preserving optical power over longer or more complex routing paths. However, fiber type alone does not guarantee performance—installation quality remains equally important.
After selecting the correct fiber type, engineers must still evaluate how physical routing affects total loss accumulation.
Connector and Patch Panel Loss
Connector interfaces are one of the most significant contributors to link budget degradation in real deployments. Each connection point introduces insertion loss due to imperfect optical alignment, surface contamination, or manufacturing tolerances.
Even when using high-quality components, losses accumulate as the number of connection points increases.
A typical breakdown of connector-related losses is shown below:
| Component |
Typical Loss per Unit |
Cumulative Impact |
| LC Connector Pair |
0.2–0.5 dB |
Moderate per connection |
| Patch Panel Interface |
0.2–0.3 dB |
Adds per cross-connect |
| Mated Connections |
Variable |
Increases with link complexity |
In dense rack environments, it is common for a single optical path to include multiple connector pairs, which can significantly reduce the available link margin.
After accounting for connectors, patch panel design should also be evaluated, as inefficient cabling layouts can introduce unnecessary additional loss points.
Installation and Maintenance Issues
Even when fiber and components meet specification, improper installation and insufficient maintenance can gradually degrade link budget performance over time. These issues are often the most unpredictable because they develop after deployment rather than during design.
Common real-world factors include:
- Contaminated or dirty fiber end faces
- Excessive bending radius causing micro-bending losses
- Loose or improperly seated LC connectors
- Physical stress on fiber cables in tight routing paths
- Aging or wear of connector polishing surfaces
Each of these issues introduces additional insertion loss that is often not accounted for in initial design calculations. In high-density environments, even small contamination can significantly affect optical power levels.
A simplified impact overview:
| Issue Type |
Effect on Signal |
Risk Level |
| Dust contamination |
High insertion loss spikes |
High |
| Cable bending stress |
Gradual signal degradation |
Medium |
| Connector misalignment |
Intermittent signal loss |
High |
Once these factors accumulate, they can reduce the effective link budget below the operational threshold, leading to unstable or degraded network performance.
🔔 Best Practices to Optimize Link Budget
Optimizing link budget in Meraki 10G-Base-SR Multi Mode deployments is not only about meeting minimum optical requirements, but about ensuring long-term stability, predictable performance, and tolerance to real-world variations. In practice, a well-optimized link budget reduces troubleshooting efforts and minimizes the risk of intermittent connectivity issues in high-speed 10GbE environments.
The most effective optimization strategies focus on reducing avoidable losses, improving infrastructure quality, and validating optical performance during and after installation.
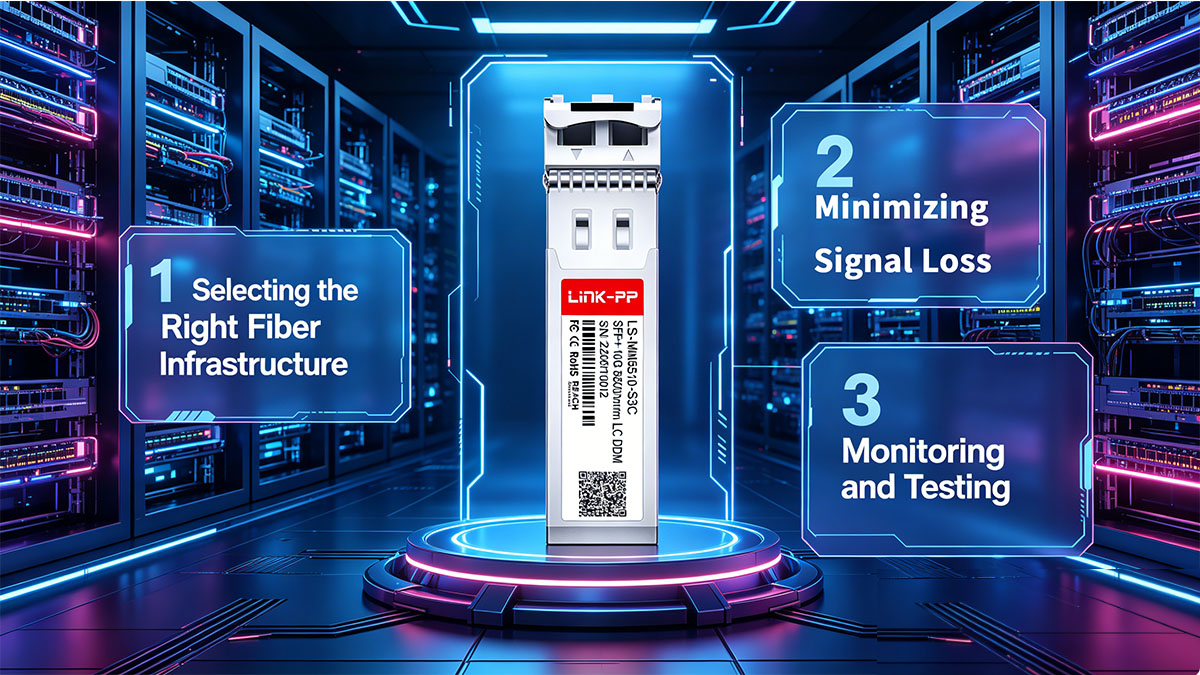
Selecting the Right Fiber Infrastructure
The foundation of a stable optical link begins with choosing the appropriate fiber type and cabling architecture. Since 10G-Base-SR operates within a relatively tight optical power window, fiber selection directly influences how much margin remains after losses.
A practical comparison of design choices helps clarify their impact:
| Selection Factor |
Recommended Choice |
Impact on Link Budget |
| Fiber Type |
OM4 preferred for margin |
Lower effective attenuation |
| Cable Route |
Short, direct paths |
Minimizes distance loss |
| Cabling Density |
Controlled bundling |
Reduces micro-bending risk |
In most modern deployments, OM4 fiber is preferred because it provides improved bandwidth-distance performance compared to OM3, offering additional flexibility when routing constraints exist.
After selecting fiber infrastructure, attention must shift to minimizing unnecessary loss points across the physical link.
Minimizing Signal Loss
Once the fiber infrastructure is defined, the next step is to reduce all avoidable sources of optical loss. Even small improvements in connector quality or cabling layout can significantly improve overall link budget headroom.
Key strategies include:
- Reducing the number of connector pairs in the optical path
- Avoiding unnecessary patch panel cross-connections
- Using factory-terminated, high-quality patch cords
- Maintaining proper bend radius to prevent micro-bending losses
- Ensuring correct LC connector seating and alignment
These practices directly reduce insertion loss, which is often the most controllable component of total link budget consumption in real deployments.
A simplified view of loss reduction priorities:
| Optimization Area |
Action |
Expected Benefit |
| Connector count |
Minimize cross-connects |
Lower cumulative dB loss |
| Cable handling |
Maintain bend radius |
Prevent signal distortion |
| Patch quality |
Use certified cords |
Improve insertion stability |
After minimizing losses, validation and monitoring become critical to ensure the improvements are effectively maintained.
Monitoring and Testing
Even a well-designed optical network requires validation to confirm that actual link performance matches calculated expectations. Monitoring and testing help identify hidden issues that may not be visible during initial deployment.
Common testing and validation methods include:
- Optical power meter measurements to verify actual signal levels
- OTDR (Optical Time Domain Reflectometer) testing for fault location and loss mapping
- Insertion loss testing across end-to-end fiber paths
- Periodic inspection of connector cleanliness and alignment
These methods allow engineers to confirm whether the link budget is being maintained within expected thresholds and whether any degradation is occurring over time.
A practical testing workflow typically follows this sequence:
- Measure baseline optical power after installation
- Compare results against calculated link budget values
- Identify any deviation beyond acceptable margin
- Clean or replace components if required
- Re-validate performance after corrective actions
In high-density Meraki deployments, regular monitoring is especially important because even small performance shifts can affect multiple interconnected systems.
🔔 Troubleshooting Link Budget Issues in 10G SR Links
When a Meraki 10G-Base-SR Multi Mode link becomes unstable or fails to come up, link budget issues are often one of the first areas to investigate. Because 10GBASE-SR operates within a relatively tight optical power window, even small deviations in loss or power levels can lead to degraded performance, intermittent connectivity, or complete link failure.
Troubleshooting link budget problems is essentially a process of identifying where optical power is being lost beyond acceptable levels and restoring the system back within its designed margin.
Identifying Symptoms of Poor Link Budget
Before performing detailed measurements, it is important to recognize the typical symptoms that indicate a link budget imbalance. These symptoms usually appear at the physical layer and may initially seem like random or intermittent network issues.
Common indicators include:
- Intermittent link up/down behavior (link flapping)
- Increased packet loss or retransmissions at higher layers
- Interface errors or CRC errors on switches
- Link not establishing despite correct physical connection
- Reduced throughput under load conditions
These symptoms often appear gradually when the link is operating near the edge of its optical budget, rather than well within safe margins.
Once these behaviors are observed, the next step is to isolate whether the issue is related to optical power levels or other network configuration problems.
Diagnostic Methods
Accurate diagnosis of link budget issues requires measuring real optical performance and comparing it against expected values. This helps determine whether losses are within acceptable limits or exceed the design threshold.
Key diagnostic approaches include:
- Measuring transmit and receive optical power using a power meter
- Checking switch interface optical diagnostics (DOM/DDM readings)
- Performing end-to-end fiber continuity tests
- Using OTDR testing to map loss points along the fiber path
A typical evaluation workflow is:
- Check received optical power at both ends of the link
- Compare values against module specifications
- Identify deviation between expected and actual loss
- Segment the link to isolate high-loss sections
- Verify connector and patch panel integrity
This structured approach helps narrow down whether the issue originates from fiber attenuation, connector loss, or transceiver-related problems.
A simplified diagnostic comparison can be useful:
| Measurement Point |
Expected Behavior |
Problem Indicator |
| TX Power |
Within spec range |
Low or unstable output |
| RX Power |
Above sensitivity threshold |
Below threshold or fluctuating |
| Total Loss |
Within link budget |
Exceeds calculated margin |
After identifying abnormal values, engineers can proceed to targeted corrective actions.
Practical Solutions
Once the source of link budget degradation is identified, corrective actions should focus on reducing unnecessary loss and restoring sufficient optical margin. In most cases, issues are caused by physical layer conditions rather than equipment failure.
Common solutions include:
- Cleaning LC connectors using proper fiber cleaning tools
- Replacing contaminated or damaged patch cords
- Reducing the number of connector pairs in the link path
- Rerouting fiber to avoid tight bends or physical stress points
- Re-seating transceiver modules to ensure proper alignment
- Upgrading fiber type (for example, from OM3 to OM4) when distance is marginal
A structured remediation approach can be summarized as:
- First, eliminate contamination and connector-related issues
- Second, simplify the physical link path to reduce insertion loss
- Third, verify fiber integrity and replace degraded segments if needed
- Finally, reassess whether the design still meets link budget requirements
In many real-world cases, cleaning and reducing connector complexity alone can restore full link stability without requiring major infrastructure changes.
🔔 Conclusion
Meraki 10G-Base-SR Multi Mode plays a critical role in modern short-range 10GbE optical networks, and its performance is fundamentally governed by link budget planning. A properly calculated and well-maintained link budget ensures that optical signals remain within safe transmission margins, preventing degradation and instability across multimode fiber links. When combined with structured design principles, Meraki 10G-Base-SR Multi Mode deployments can achieve highly reliable performance in data center and enterprise environments.
At the same time, link budget analysis is not a one-time calculation but an ongoing validation process that must account for fiber type, connector quality, and environmental factors throughout the lifecycle of the network.
Key takeaways:
- Link budget defines the usable optical power margin between transmitter and receiver
- Even small losses in connectors or patch panels can significantly impact 10GBASE-SR stability
- OM4 fiber generally provides better tolerance and distance performance than OM3
- Real-world conditions such as contamination, bending, and aging reduce theoretical performance
- Safety margin (typically 1–2 dB) is essential for long-term operational stability
- Regular testing and monitoring help prevent hidden degradation over time
These points highlight that stable 10Gbps multimode performance depends on both correct design and disciplined physical layer management.
For organizations building or upgrading high-speed optical networks, ensuring accurate link budget planning is only part of the overall solution. Selecting high-quality optical components and maintaining consistent manufacturing standards are equally important for long-term reliability.
To support stable and efficient 10G-SR deployments, it is essential to source optical modules and fiber components that meet strict performance and compatibility requirements. Solutions from the LINK-PP Official Store provide a reliable option for building scalable and standards-compliant optical networks, helping ensure that link budget targets are consistently achieved in real-world installations.